Home > End User Functions > Using Designer Tabs > Summaries / Statistics
Summaries / Statistics
Numeric Custom Table data can be totaled.
Summarizing Data
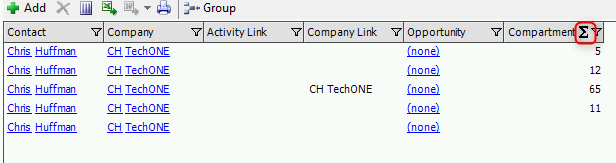
- Columns containing numeric data will display a ∑ symbol in their title bar. Click on the ∑ symbol.
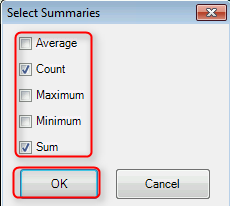
- The Summaries dialog box with appear. Select the appropriate function:
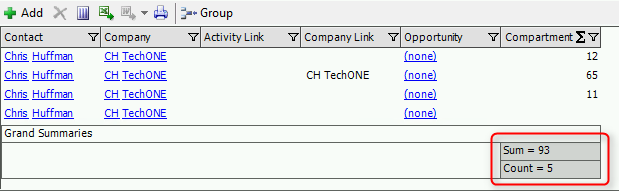
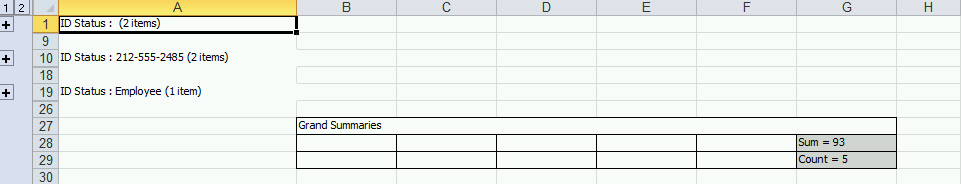
- Summaries will appear at the bottom of the list.
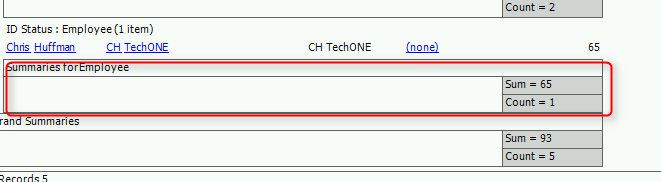
- Summaries will rollup with Grouping.
- Summaries will be included in Exports to Excel.
See also
| 


