Home > Tutorials > Creating A KPI
Creating A KPI
A KPI allows you to display different fields in the KPI other than just the activity type. You can also open up each KPI and drill down to the record that was created.
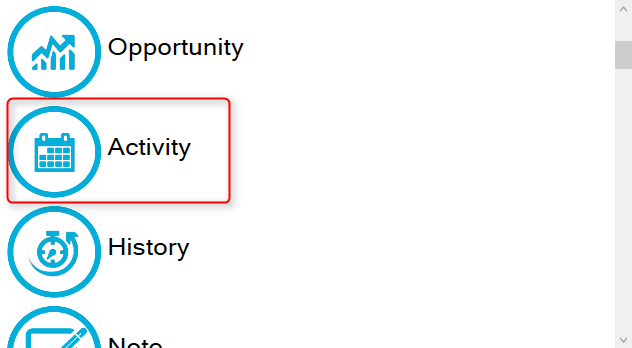
1. To create a KPI you first must choose a query and click next
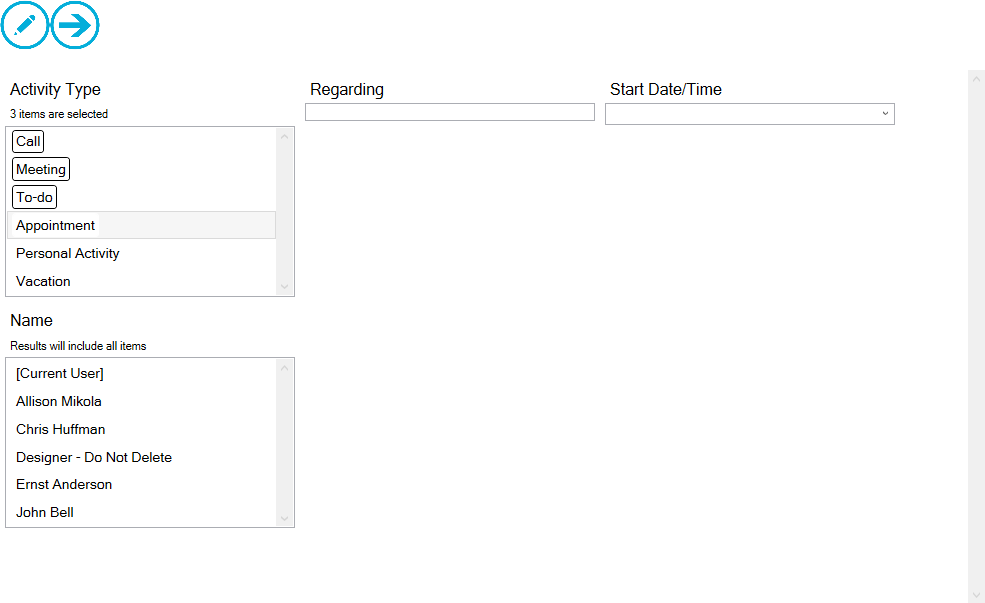
2. Next specify what type of Filters you want to run and what fields to search on
3. This is where the new features of ToplineDash come into play. From now on the initial KPI created will be a SIMPLE KPI by default in order to make it simpler for the user.
*NOTE: The Complex KPI is still available as an option it will just need to be created after the table is generated.*
1. Table Field is in. Eg; Activity Type is in Activity Field
2. Field Name
3. Field Value In this example I will be using Activity Type 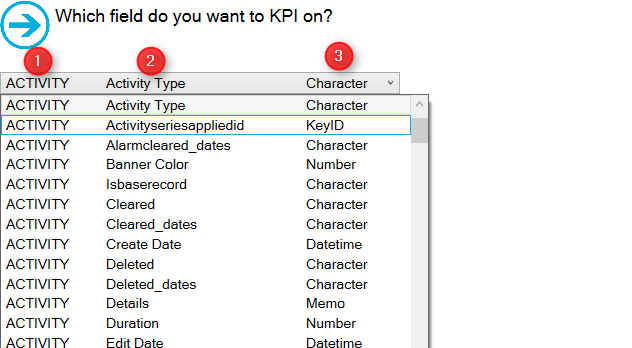
6. Click the right arrow on the top right
7. The data is now display in a Simple KPI format
8. A new feature of this Topline Dashboard update is shown when you click on the magnify glass. Below you will see the query that was created automatically based on the filters chosen by us during the set up 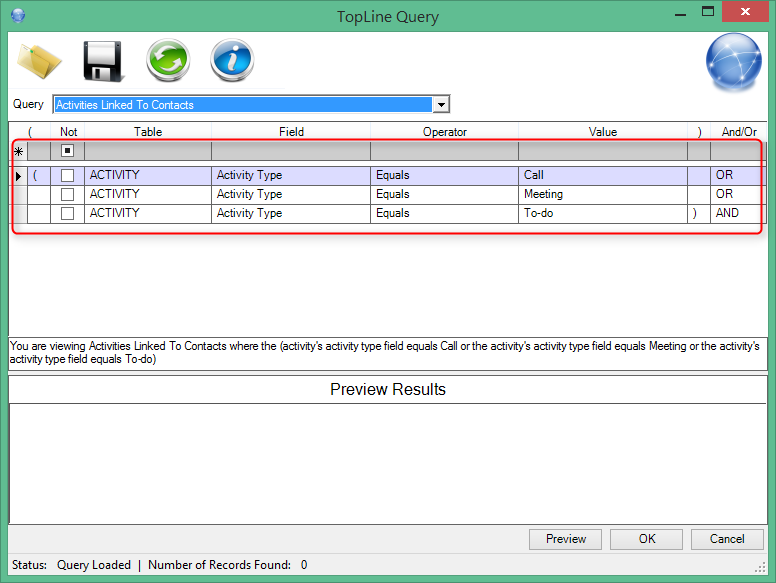 9. If you double click a record you can drill down see the details of each entry that was created. The KPI results shows what fields you are currently using in your KPI
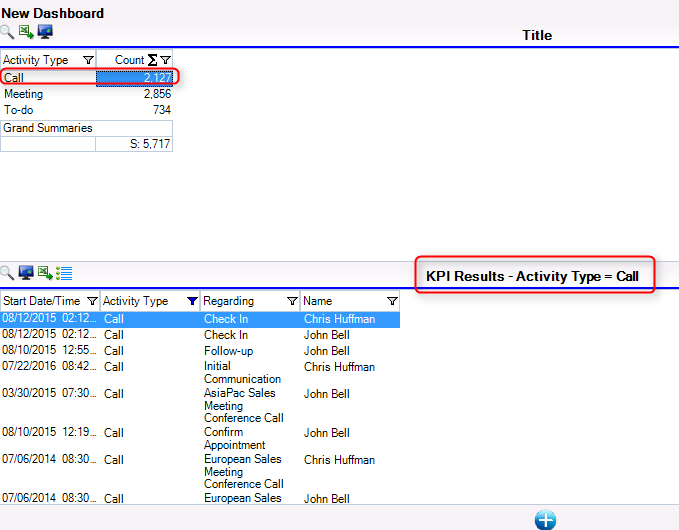
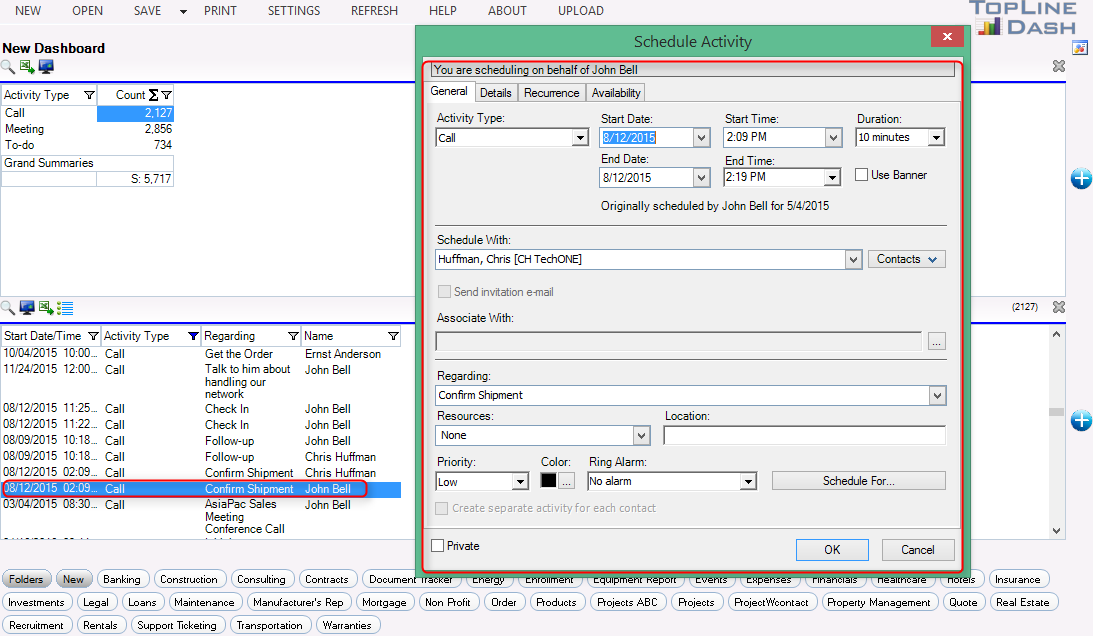
10. You can also double click a record in the KPI results panel to open up that entries activity detail
Complex KPI
If you want to make your KPI into a complex KPI you will first need to click the screen on the Dashboard toolbar.
The image below should have now appears
1. Complex KPI allows you to display a different field for the top row and the left column. A simple KPI only allows for the left column to be changed.
2. The top row is where you will have data from a field display across the top of the KPI (see example picture)
3. The left column is where you will have data from a field display in the left hand column (see example picture)
4. Both the top row and left columns will only let you display fields from the data that is returned from the query.
See also
Simple Dashboard
Creating a Graph
Advanced Query (Only Wizard)
|